
Asset Class Categories
At the end of every quarter, Koch Capital updates its internal portfolio model statistics. The first series I update is for our FLEX strategies. FLEX is the short name for the Global RIsk-Managed Flexible Core strategy, which serves as the linchpin investment strategy for all Koch Capital clients given its broad diversification across many global asset class categories.
At the beginning of 2015, I covered the annual returns (and volatility) of many of these asset classes in my Period Table of Benchmark Asset Class ETF Returns provided below. This blog post explains the periodic table results from 2001 through 2013 if interested.
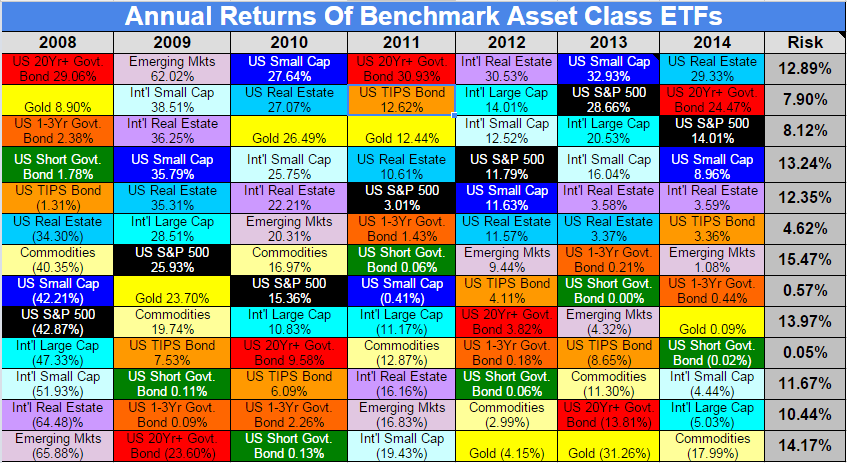
Source: Koch Capital, Quantext Portfolio Planner
The FLEX asset allocation utilizes ten stock asset class categories, many like those from the periodic table above, three bond asset class categories, one alternative asset class and cash — fifteen asset class categories altogether. There are five portfolio versions of FLEX covering five distinct risk profiles: Aggressive, Moderate, Balanced, Conservative and Defensive.
Stocks vs. Bonds
The difference between the Aggressive FLEX allocation versus the Defensive FLEX allocation is the weighting of the ten stock asset class categories relative to the three bond asset class categories. For example, Aggressive FLEX (FLEX.AGG) holds approximately 83% in global stocks and 9% U.S. bonds. Likewise, Defensive FLEX (FLEX.DEF) currently holds approximately 36% in global stocks and 56% in U.S. bonds. The remaining unallocated percentage is used for cash and alternative investments. Please note the five FLEX allocations change their stock-to-bond weightings over time to better match their target risk profiles.
Every quarter when I run my portfolio analytics for the five FLEX strategies — Aggressive (FLEX.AGG), Moderate (FLEX.MOD), Balanced (FLEX.BAL), Conservative (FLEX.CON) and Defensive (FLEX.DEF) — I review the 3-year average historical return and risk (standard deviation) for each of the five FLEX strategies, as well as the forward-looking return and risk estimates for the same five FLEX strategies.
Connecting the Dots
These ten data points are graphed as circles in the diagram below. The circle names ending with “3” represent the 3-year average return up to the end of the last quarter (03/31/2014). The circle names ending with “e” represent the model’s forwarding-looking return and risk (volatility) estimates. Please note for this example, I’m using risk, volatility and standard deviation interchangeably, even though risk and volatility are not the same animal.
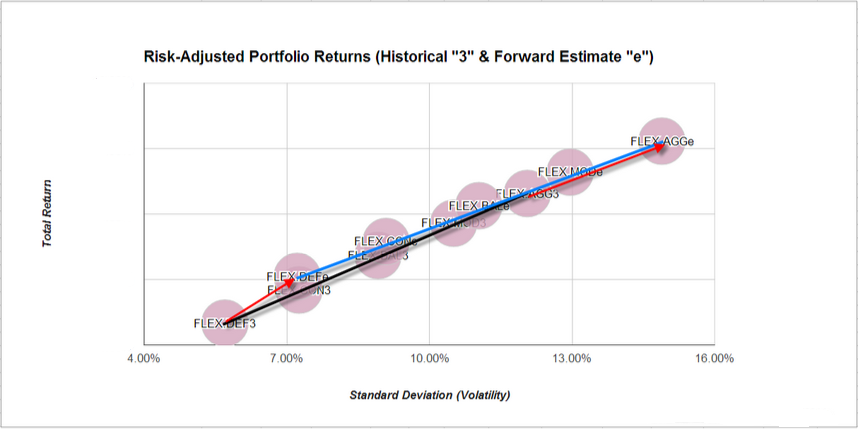
Source: Koch Capital, Quantext Portfolio Planner as of 03/31/2014
By connecting the dots (the circles above), one sees more clearly what the model is saying about the possible future returns and volatility of the five FLEX stock-to-bond portfolio combinations. I’ve drawn a black line through the 3-year historical average return-versus-risk FLEX circles, and a blue line through the forward-looking return-versus-risk FLEX estimates. I also included two red directional arrows (vectors) pointing from the FLEX.DEF3 (historical) circle to the FLEX.DEFe (forward-looking estimate) circle, and from FLEX.AGG3 to FLEX.AGGe. The next graph below provides four examples of how to interpret the black historical return-versus-risk line in relation to the blue forecasted return-versus-risk line.
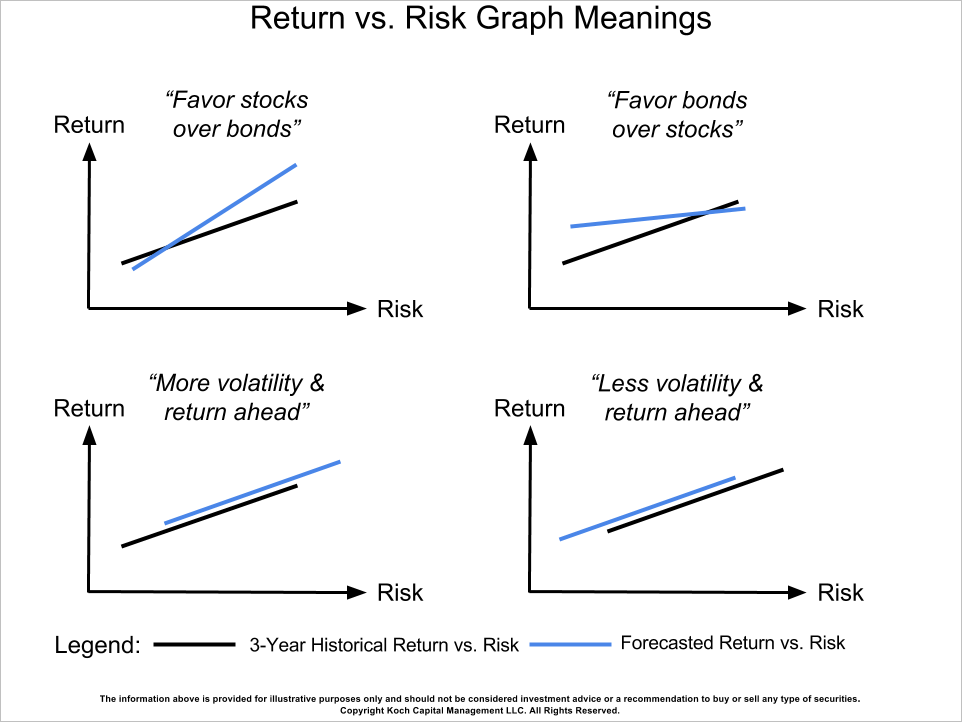
Source: Koch Capital
Not to be overly mathematical here, but slope really matters in this type of analysis. Whether the forecasted blue line is steeper or flatter relative to the historical black line tells us a lot about medium-term (two to five years) valuations of stocks, in the global aggregate, versus bonds, in the U.S. aggregate. More importantly, it helps the investment manager (me) better position portfolios to get the most return possible for a given level of risk.
You’ll also note that, in general, all return-versus-risk lines start from the lower left and end in the upper right to denote the universal investing principle of taking more risk should produce more return. But the likelihood that the universal investing principle holds true is predicted by the slope differential between the two lines. The steep blue line compared to the black line in the first graph example above (upper left) demonstrates the case where the model is forecasting more return per unit of risk taken as you increase your stock allocation while proportionally reducing your bond holdings. And the flat blue line relative to the black line line in the second graph example above (upper right) is predicting the opposite.
Looking back at the original ten FLEX circles graph with my annotations, you’ll see the forecast blue line running almost parallel to the historical black line, but with the blue line is shifted to the right like our third graph example above (lower left). The caption for that example reads “more volatility & return ahead”, meaning the model is predicting more portfolio volatility ahead for all five FLEX strategies. And with the extra volatility, if you can stomach it, better returns are expected but not guaranteed.
Directional Trend and Strength
What should a FLEX or any broadly-diversified fund investor do with this information? The final graph below describes possible actions a FLEX investor should consider, in my opinion, if she believes her current FLEX strategy is trending decisively in the direction of one of the four quadrants. As with any forward-looking portfolio return and risk (volatility) estimates, there are both directional and magnitudinal uncertainties when forecasting two to five years out in the future.
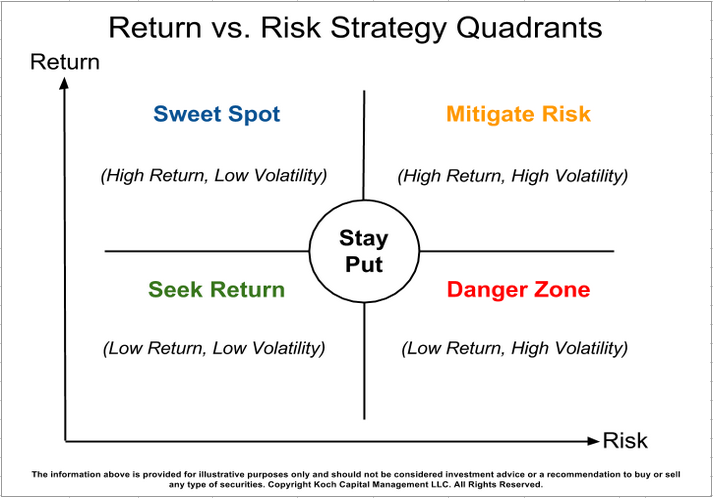
Source: Koch Capital
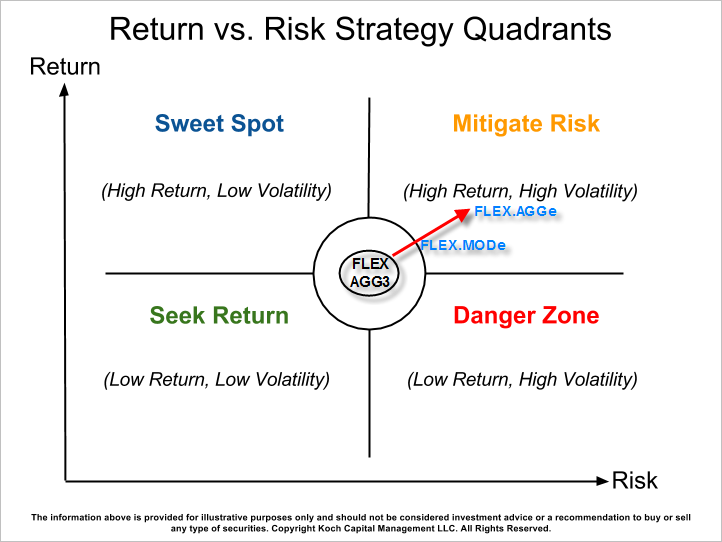
Back again to my original ten FLEX circles graph where I drew two red vector arrows from the FLEX.DEF3 (historical) circle to the FLEX.DEFe (estimate) circle, and from the FLEX.AGG3 circle to the FLEX.AGGe circle. To use the portfolio-specific red vector arrows, which are forecasting expected directional and magnitudinal return-versus-risk portfolio changes, imagine placing the FLEX.DEF3 (historical) circle smack in the middle of the “Stay Put” circle above. Next overlay the red vector arrow associated with the FLEX.DEF strategy onto the four quadrant graph above, and you’ll get a new graph like the one below.
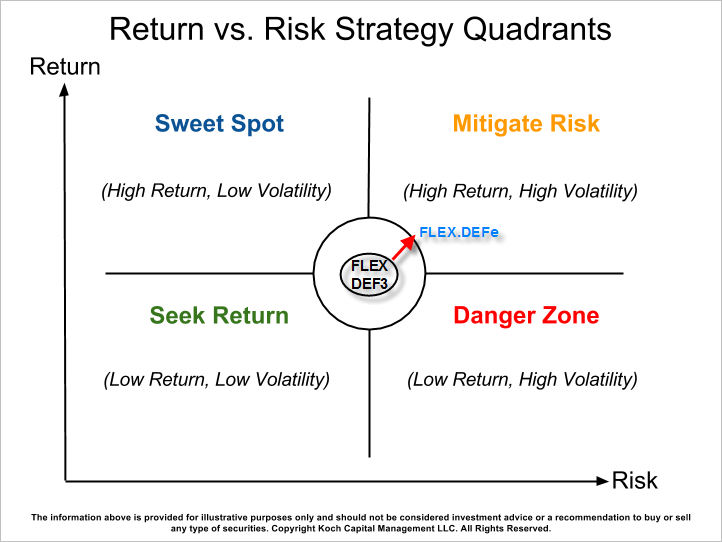
Source: Koch Capital
While the FLEX.DEF vector is pointing up and to the right at a slightly steeper angle (a.k.a. a smidge more forecasted return per unit of risk taken) than the FLEX.AGG vector, both vectors are clearly pointing (directionally) to the Mitigate Risk zone above. The vector length (magnitude) predicts the “strength” of the potential change in that portfolio’s return-versus-risk characteristics. For example, the shorter FLEX.DEF vector above may be telling us to do nothing given its vector is not significantly outside the “Stay Put” circle.
Re-balancing a portfolio when it strays slightly from its target return-versus-risk portfolio characteristics can be a costly endeavor in terms of additional fee drag and unintended portfolio behavioral consequences. In addition, next quarter’s analysis may show the FLEX.DEF vector moving back toward its original return and risk targets. In my humble opinion, portfolio modification based on this type of quantitative analysis is still more an art than a science given we are dealing with unpredictability of a complex system (a.k.a. the stock market) in the medium-term.
Source: Koch Capital
On the other hand, FLEX.AGG’s red vector is much longer (stronger forecasted magnitudinal change). This could indicate that a strategy modification, like a portfolio re-balance with new asset class weights, or even shifting from one FLEX strategy to the next one is in order to maintain roughly the target return-versus-risk portfolio characteristics.
For example, if the FLEX investor is currently invested in the FLEX.AGG3 strategy and prefers its historical average portfolio volatility of approximately 12% (see my original ten FLEX circles graph), then she may not like the forecasted FLEX.AGGe volatility of roughly 15%. So the FLEX.AGG investor may decide to shift down a risk profile notch to the FLEX.MOD strategy given FLEX.MODe’s (forecasted) return is about the same as FLEX.AGG3’s (historical) return with just a tad more expected volatility at 13%. To see what the volatility (risk) difference between 12% and 15% feels like, try my Growth Paths application by checking the Include Volatility box and moving the Expected Standard Deviation slider between 12% and 15%.
In summary, the FLEX strategies provide the investor with a flexible, cost-effective investing platform. We use many of the Schwab OneSource commission-free Exchange-Traded Funds (ETFs) to reduce re-balancing and trading costs. In addition, the FLEX portfolios’ expense ratios are less than 0.25%. However, even with the capability to easily switch from one FLEX strategy to another, that doesn’t mean the FLEX investor should do so regularly. Please remember that the model is attempting to predict medium-term (two to five years) future portfolio return-versus-risk trends, so it’s best to stay put if your long-term investing goals remain the same from quarter to quarter.
If you find this level of portfolio analysis of interest, I summarize this information every quarter in 10 to 15 minute videos and make them available to investors on our Schwab Managed Accounts platform. Please complete this access request form if you would like me to add your email address to the video library access list to view the older videos. Koch Capital reserves the most recent videos for our Managed Accounts clients. You’ll need to also read and acknowledge a disclaimer that the information provided is confidential and subject to frequent change.
Thank you for your continued support and feedback........Jim
About Jim Koch
Jim Koch is the Founder and Principal of Koch Capital Management, an independent Registered Investment Advisor (RIA) in the San Francisco Bay Area. He specializes in providing customized financial solutions to advisors, individuals, families, trusts and business entities so they are better able to achieve their goals. Jim sees himself as an "implementer" of financial innovation, using state-of-the-art technology to provide practical investment management and retirement income planning solutions for clients.
General Disclosures
This information is provided for informational/educational purposes only. The opinions referenced are as of the date of publication and are subject to change due to changes in the market or economic conditions and may not necessarily come to pass. Nothing presented herein is or is intended to constitute investment advice, and no investment decision should be made based on any information provided herein. The information contained herein, while not guaranteed as to the accuracy or completeness, has been obtained from sources we believe to be reliable. Past performance is no guarantee of future results.
Any forward looking statements or forecasts are based on assumptions and actual results are expected to vary from any such statements or forecasts. No reliance should be placed on any such statements or forecasts when making any investment decision. Under no circumstances does the information contained within represent a recommendation to buy or sell any particular security or pursue any investment strategy. There is a risk of loss from an investment in securities. Different types of investments involve varying degrees of risk, and there can be no assurance that any specific investment will be profitable or suitable for a particular investor’s financial situation or risk tolerance. Please refer to the Site Disclosure page for additional information.
Nothing contained herein should be interpreted as legal, accounting, or tax advice. Any tax statements contained herein were not intended or written to be used, and cannot be used for the purpose of avoiding U.S. federal, state or local tax penalties. Tax issues can be complicated. Please consult your tax advisor for personal tax questions and concerns.
Use of Calculators, Planning Tools, and Other Devices
The use of any calculator, tool, or similar device contained within or linked to this website is subject to your acknowledgement and understanding that the projections or other information generated by any such tools is not, and should not be construed, in any manner whatsoever, as the receipt of, or a substitute for, personalized individual advice from Koch Capital, or from any other investment professional. The projections or other information generated by such tools regarding the likelihood of various investment outcomes are hypothetical in nature, do not reflect actual investment results, are not guarantees of future results, and may not reflect the actual growth or costs of your own investments. These tools are designed for informational and educational purposes only and should not be considered investment advice. No reliance should be placed on any such information when making an investment decision. Koch Capital makes no warranties of any kind, and disclaims liability to any person for any actions taken or omitted in good faith with respect to such tools. Koch Capital obtains the information provided via these tools from third party sources believed to be reliable but not guaranteed. Koch Capital is not responsible for the consequences of any decisions or actions taken as a result of information provided by such tools and does not warrant or guarantee the accuracy or completeness of the information requested or displayed. Please refer to the Site Disclosure page for additional information.
Third Party Information
While Koch Capital has used reasonable efforts to obtain information from reliable sources, we make no representations or warranties as to the accuracy, reliability, timeliness, or completeness of third party information presented herein. Any third party trademarks appearing herein are the property of their respective owners. At certain places on this website, live 'links' to other Internet addresses can be accessed. Koch Capital does not endorse, approve, certify, or control the content of such websites, and does not guarantee or assume responsibility for the accuracy or completeness of information located on such websites. Any links to other sites are not intended as referrals or endorsements, but are merely provided for convenience and informational purposes. Use of any information obtained from such addresses is voluntary, and reliance on it should only be undertaken after an independent review of its accuracy, completeness, efficacy, and timeliness.
No comments:
Post a Comment
Note: Only a member of this blog may post a comment.