Monday, May 11, 2020

2020 Q2 Client Update Snippets (Simple Technicals, Deep Risk, Loss of Control)


These topics were covered in my 04/01/2020 newsletter to Koch Capital's investment management and retirement planning clients. With the S&P 500 hovering around the 2900 range, the stock market is currently pricing in the best case recovery scenario. This outcome is difficult to fathom given all the virus unknowns and the inter-linked risks of starting up an economy in stasis (think of the cold power-up of the command module scene in the movie Apollo 13). However, the most likely outcome is and will always be a better day tomorrow.
_____________________________


What the Stock Market IsTelling Us
Quite a first quarter! I’m going to jump straight into the financial implementations of this coronavirus-induced market sell-off, ignoring the health and lifestyle issues as I’m sure you are already receiving a fire hose of infection data and what-it-all-means commentary.


Source: Stockcharts.com with Koch Capital annotation

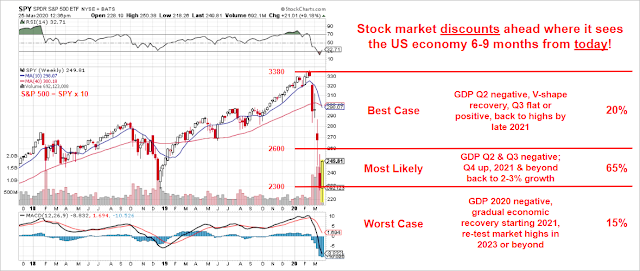
With yesterday’s stock market close (4/1/2020), the SPY ETF (our S&P 500 proxy for the overall stock market) settled around 2460, down 27% from the February high water mark of 3380. The annotated stock chart above shows the SPY price decline since hitting its February peak. I added the three red bands to provide an approximate range of possible future market outcomes based on the SPY daily close on any given day this month.

The stock market discounts forward to where it thinks the economy and corporate earnings will be nine months or so from today. If the market closes between 2600 and 2300, then it is forecasting a moderate recession with negative GDP growth in Q2 and Q3 and a return to positive growth in Q4. If the market closes….again, on any given day during April….above the 2600 level, the market sees a mild recession with a V-shape rapid recovery. Nobody knows how this sell-off will play out. As the market consumes the latest coronavirus data, it will adjust its forward economic outlook by raising or lowering that day’s SPY closing price.

While many market pundits as well as myself believe that the most likely outcome of the coronavirus pandemic is a mild-to-moderate recession through 2020, nobody can know for sure how this recession will play out. If the stock market (SPY) re-tests the previous low range below 2300….and stays there throughout April….then the market is predicting a severe recession lasting 2-5 years (my estimate) or even the possibility of a depression lasting longer.

No doubt the next two weeks will be scary given the peak negative news cycle. The market may retest the 2300 level, a peak-to-trough decline of more than 32%. The key is whether the market stays below the 2300 level for next six weeks. That would signal, in my opinion, an expected economic contraction more serious and long lasting than just a mild or moderate recession. But markets can be wrong too.

Shallow Risk vs. Deep Risk
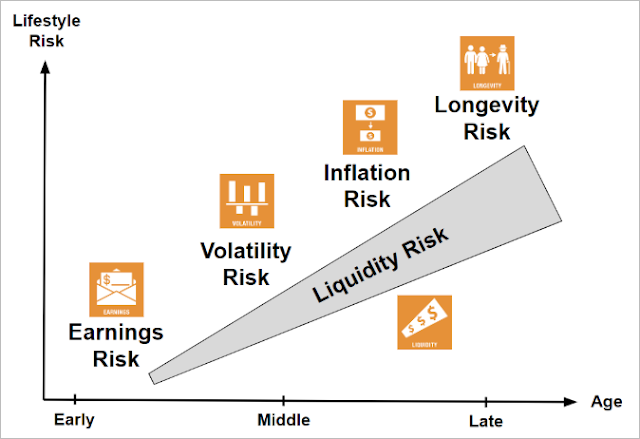
With Koch Capital’s Retirement Planning clients, we spend considerable planning time and energy addressing the five primary risk categories listed below. For a good overview of these risk types, please see my risk overview video. The coronavirus pandemic primarily impacts investment risk, a type of volatility risk, which affects households that have substantial savings invested in the stock market.


Source: The InformedHousehold.com®

All risk types have both a magnitude and a duration component, which characterize whether a given risk danger is shallow or deep. For example, market sell-offs favor shallow volatility risk since the typical price decline is less than 20% and generally recovers within a year. Beginning in early 2000, the NASDAQ tech-heavy index fell over 70% through 2002 and then took 15 years to recover. That’s deep volatility risk.

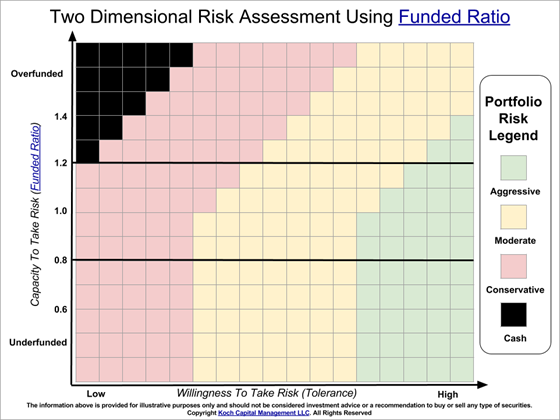
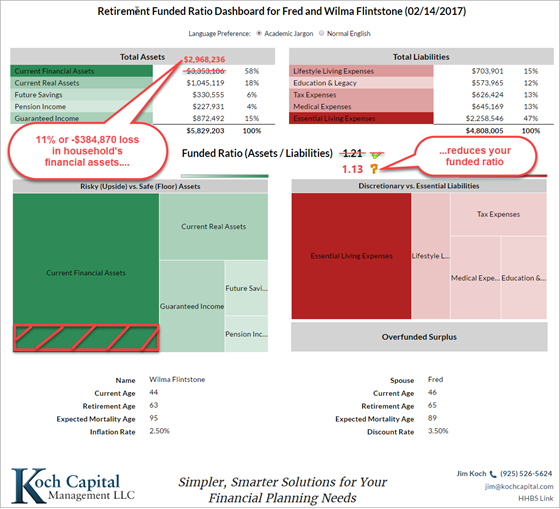
While market sell-offs hurt all investors, the 2000-2002 correction impacted (think permanent reduction in living standard) disproportionately those who foolishly invested in just the hot tech stocks of the day. Deep volatility risk can be mitigated through global asset class diversification. But to eliminate this risk, you have to either diversify substantially beyond stocks into less volatile assets like cash and cash equivalents, social security (delaying), government bond ladders, guaranteed annuities, physical gold, private pensions, etc., or have enough risk capacity (high funded ratio) to ride out a prolonged market downturn.

The coronavirus pandemic is exposing households to other potential deep risk types. If your job goes away and you cannot re-tool into another profession that generates an equivalent wage, that’s potentially deep earnings risk. If your cash cushion is drawn down and you have to execute an emergency IRA withdrawal, that’s potentially deep liquidity risk. If the flood of relief dollars to coronavirus victims leads to a new generational cycle of persistent high inflation, that’s deep inflation risk. While I’m not predicting any of these scenarios, they are all contingencies we should consider and plan for.

While most shallow risk dangers are transient and self correcting, deep risk events trigger whole system failures, like a permanent funding shortfall of your desired retirement lifestyle. One deep risk type failure can cascade into another and then another, resulting in permanent loss of financial resources. This linkage between risk types is called dependent risk, and it’s always deep and unpredictable. For more on risk types if interested, please see William Bernstein’s brilliant booklet on the subject.
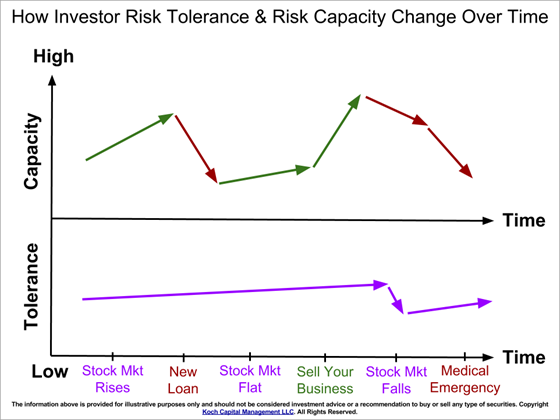
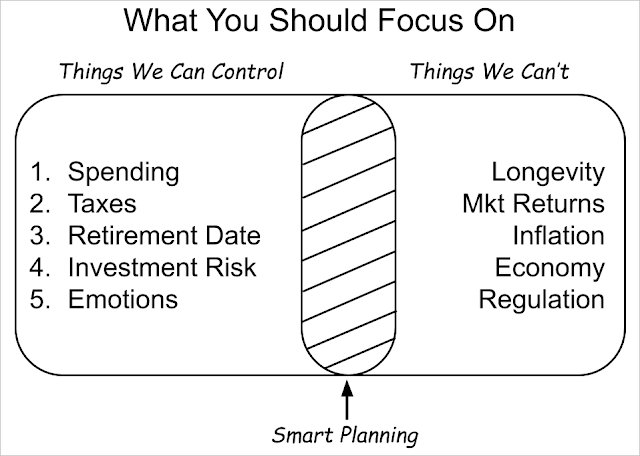
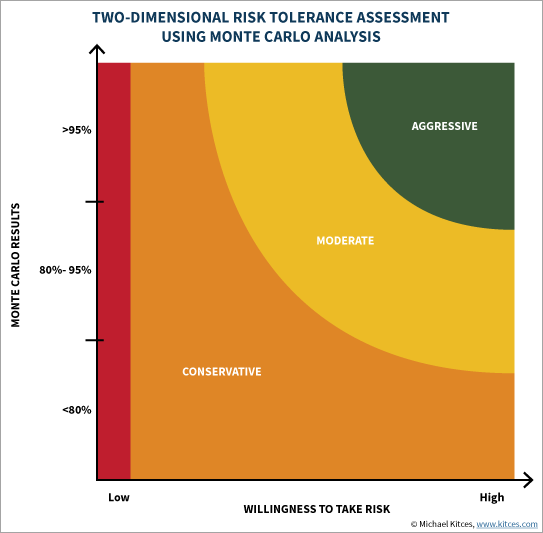
What We Can Control
The loss of control in your personal life takes a huge emotional toll. The diagram below reminds us that we still control certain financial aspects of our lives. I can help you on the emotional side with trading decisions, budgeting your cash reserves and minimizing investment taxes. On your end, please consider revisiting your current budget assumptions, desired retirement date, if not already retired, and your ideal investment risk preference.


Source: Koch Capital

We’ll get through this crisis household by household and as a nation. Post-coronavirus I’m ready to re-assess your investment risk preference if this market sell-off is feeling a tad too scary. My best advice right now is to stay the course and ride out the wild stock price swings. The best stock market gains of the year usually follow immediately after the worst losses.

Please stay safe, positive, and thank a healthcare worker. All the best...Jim


About Jim Koch 
Jim Koch is the President of Koch Capital Management, an independent Registered Investment Advisor (RIA), and Founder and Principal of the Informed Household financial education and smart budgeting website located in the San Francisco Bay Area. As a fiduciary, he specializes in providing customized financial solutions to individuals, families, trusts and business entities so they are better able to achieve their financial goals. Jim sees himself as an “implementer” of financial innovation, using state-of-the-art technology to provide practical investment management and retirement planning solutions for clients

General Disclosures
This information is provided for informational/educational purposes only. The opinions referenced are as of the date of publication and are subject to change due to changes in the market or economic conditions and may not necessarily come to pass. Nothing presented herein is or is intended to constitute investment advice, and no investment decision should be made based on any information provided herein. The information contained herein, while not guaranteed as to the accuracy or completeness, has been obtained from sources we believe to be reliable. Past performance is no guarantee of future results.

Any forward looking statements or forecasts are based on assumptions and actual results are expected to vary from any such statements or forecasts. No reliance should be placed on any such statements or forecasts when making any investment decision.Under no circumstances does the information contained within represent a recommendation to buy or sell any particular security or pursue any investment strategy. There is a risk of loss from an investment in securities. Different types of investments involve varying degrees of risk, and there can be no assurance that any specific investment will be profitable or suitable for a particular investor’s financial situation or risk tolerance. Asset allocation and portfolio diversification cannot assure or guarantee better performance and cannot eliminate the risk of investment losses. Please refer to the Site Disclosure page for additional information.

Third Party Information
While Koch Capital and the Informed Household have used reasonable efforts to obtain information from reliable sources, we make no representations or warranties as to the accuracy, reliability, timeliness, or completeness of third party information presented herein. Any third party trademarks appearing herein are the property of their respective owners. At certain places on this website, live 'links' to other Internet addresses can be accessed. Neither Koch Capital nor the Informed Household endorse, approve, certify, or control the content of such websites, and does not guarantee or assume responsibility for the accuracy or completeness of information located on such websites. Any links to other sites are not intended as referrals or endorsements, but are merely provided for convenience and informational purposes. Use of any information obtained from such addresses is voluntary, and reliance on it should only be undertaken after an independent review of its accuracy, completeness, efficacy, and timeliness.

Monday, July 22, 2019

Why Investment Fees Matter - A Deep Space Journey


Not All Fees Are Created Equal, Nor Transparent
In this post I’m revisiting the importance of keeping your investment fees low through a visual (video) demonstration of how compounding fees impact your portfolio returns and performance. Unfortunately, most households do NOT know their total cost of investment account ownership. This post with its video will provide you with a better understanding of the various investment fee types and how to manage them.
 
Source: Koch Capital, Informed Household


The full video is available here. If you like what you see please subscribe to our YouTube channel. If you were underwhelmed, please tell me how to improve it.

All the best…..Jim Koch (jim@kochcapital.com)


About Jim Koch 
Jim Koch is the President of Koch Capital Management, an independent Registered Investment Advisor (RIA), and Founder and Principal of the Informed Household financial education and smart budgeting website located in the San Francisco Bay Area. As a fiduciary, he specializes in providing customized financial solutions to individuals, families, trusts and business entities so they are better able to achieve their financial goals. Jim sees himself as an “implementer” of financial innovation, using state-of-the-art technology to provide practical investment management and retirement planning solutions for clients.

General Disclosures
This information is provided for informational/educational purposes only. The opinions referenced are as of the date of publication and are subject to change due to changes in the market or economic conditions. Nothing presented herein is or is intended to constitute advice to use or buy any of third-party applications presented here, and no purchase decision should be made based on any information provided herein. The information contained herein, while not guaranteed as to the accuracy or completeness, has been obtained from sources we believe to be reliable. Past performance is no guarantee of future results.

Any forward looking statements or forecasts are based on assumptions and actual results are expected to vary from any such statements or forecasts. No reliance should be placed on any such statements or forecasts when making any investment decision.Under no circumstances does the information contained within represent a recommendation to buy or sell any particular security or pursue any investment strategy. There is a risk of loss from an investment in securities. Different types of investments involve varying degrees of risk, and there can be no assurance that any specific investment will be profitable or suitable for a particular investor’s financial situation or risk tolerance. Asset allocation and portfolio diversification cannot assure or guarantee better performance and cannot eliminate the risk of investment losses. Please refer to the Site Disclosure page for additional information.

Third Party Information
While Koch Capital has used reasonable efforts to obtain information from reliable sources, we make no representations or warranties as to the accuracy, reliability, timeliness, or completeness of third party information presented herein. Any third party trademarks appearing herein are the property of their respective owners. At certain places on this website, live 'links' to other Internet addresses can be accessed. Koch Capital does not endorse, approve, certify, or control the content of such websites, and does not guarantee or assume responsibility for the accuracy or completeness of information located on such websites. Any links to other sites are not intended as referrals or endorsements, but are merely provided for convenience and informational purposes. Use of any information obtained from such addresses is voluntary, and reliance on it should only be undertaken after an independent review of its accuracy, completeness, efficacy, and timeliness.

Monday, February 25, 2019

Benchmark Asset Class ETF Returns for 2018

Chemistry 101
Below you’ll see what people in the investment business refer to as the periodic table of (asset class)
returns—named in honor of the periodic table of elements that we all studied in our high school
chemistry class. Koch Capital updates this table annually with the one-year returns and standard
deviation (volatility) of 13 benchmark asset class Exchanged-Traded Funds (ETFs), which collectively
represent a broad, global swath of the investable universe.


The table lists the annual returns for each asset class, ranked from best to worst such that the asset
classes with the highest returns are listed above those with the lowest returns for the year. The
volatility column to the far right displays the annual standard deviation of each asset class to its
immediate left; the higher the value, the more volatile that asset class’ price fluctuations.

Click here to view the entire chart and remember that past performance is not indicative of future results
Source: Koch Capital, InvestSpy, Yahoo Finance
Color Matters
The asset classes are organized by color to make the table presentation more interesting. For
example, all the equity (stock) categories are shown in the blues and purples; the S&P 500, a
common equity benchmark, stands out in its signature black. The fixed income (bond) categories
are in red, orange and tan, and bleed into the yellow colors, which represent alternative asset
categories. For this demonstration, the alternatives include just gold and commodities. In green, cash
(and cash equivalents), the thirteenth asset class category, is represented by short-term Treasury
bonds that mature in one year or less.

While 2017 was a phenomenal year for both stocks and bonds, 2018 was the opposite. Only cash and
short-term bonds eked out positive returns. Rising interest rates caused the longer duration TIPS and
20-year Treasury bond prices to fall.  And the end-of-year swoon in global equity markets sunk all
broad stock asset classes for 2018.

In summary, cash became investable again given the Federal Fund Rate increase.  Owning some
cash in your portfolio helped to counteract the downdraft in your stocks and bonds. If 2017-2018 was
all about the synchronized global growth story, 2019 is all about the possible synchronized global
slowdown given US-China trade tensions, stagnant Europe and the uncertain political environment.
At least we’ll see if the stock market can climb a wall of worry in 2019.

Pattern Hunting
As humans our brains naturally try to find patterns in what we see. Do you see any predictable pattern
of asset class returns from one year to the next? The answer is no. The point here is that asset class
returns are random no matter how convincingly your brain tells you, “Hey, I see a repeating historical
pattern here and I’m sure it will repeat this way in the future.”

Occasionally there will be years when both stocks (S&P 500) and bonds (US Gov’t 20-year Treasury)
deliver negative returns, and 2018 was one of those rare years. It appears that the 35-year bull market
run in bonds over, but we still need see long-term interest rates creep up beyond 3% to indicate the
economy improving and/or inflation is rising. And when it does, make sure you have a strategy to
control your emotions and a plan to stay the course given bonds could get whacked again.
   

About Jim Koch
Jim Koch is the Founder and Principal of Koch Capital Management, an independent Registered Investment
Advisor (RIA) in the San Francisco Bay Area. He specializes in providing customized financial solutions to
individuals, families, trusts, business entities and other advisors so they are better able to achieve their goals.
Jim sees himself as an “implementer” of financial innovation, using state-of-the-art technology to provide practical
investment management and retirement planning solutions for clients.

General Disclosures
This information is provided for informational/educational purposes only. The opinions referenced are as of the date of publication and are subject
to change due to changes in the market or economic conditions and may not necessarily come to pass. Nothing presented herein is or is intended
to constitute investment advice, and no investment decision should be made based on any information provided herein. The information contained
herein, while not guaranteed as to the accuracy or completeness, has been obtained from sources we believe to be reliable. Past performance is
no guarantee of future results.

Any forward looking statements or forecasts are based on assumptions and actual results are expected to vary from any such statements or
forecasts. No reliance should be placed on any such statements or forecasts when making any investment decision.Under no circumstances
does the information contained within represent a recommendation to buy or sell any particular security or pursue any investment strategy.
There is a risk of loss from an investment in securities.  Different types of investments involve varying degrees of risk, and there can be no
assurance that any specific investment will be profitable or suitable for a particular investor’s financial situation or risk tolerance. Asset
allocation and portfolio diversification cannot assure or guarantee better performance and cannot eliminate the risk of investment losses.
Please refer to the Site Disclosure page for additional information.

Third Party Information
While Koch Capital has used reasonable efforts to obtain information from reliable sources, we make no representations or warranties as to the
accuracy, reliability, timeliness, or completeness of third party information presented herein. Any third party trademarks appearing herein are the
property of their respective owners. At certain places on this website, live 'links' to other Internet addresses can be accessed. Koch Capital does
not endorse, approve, certify, or control the content of such websites, and does not guarantee or assume responsibility for the accuracy or
completeness of information located on such websites. Any links to other sites are not intended as referrals or endorsements, but are merely
provided for convenience and informational purposes. Use of any information obtained from such addresses is voluntary, and reliance on it should
only be undertaken after an independent review of its accuracy, completeness, efficacy, and timeliness.

Monday, January 22, 2018

Benchmark Asset Class ETF Returns for 2017


Chemistry 101
Below you’ll see what people in the investment business refer to as the periodic table of (asset class)
returns—named in honor of the periodic table of elements that we all studied in our high school
chemistry class. Koch Capital updates this table annually with the one-year returns and standard
deviation (volatility) of 13 benchmark asset class Exchanged-Traded Funds (ETFs), which collectively
represent a broad, global swath of the investable universe.

The table lists the annual returns for each asset class, ranked from best to worst such that the asset
classes with the highest returns are listed above those with the lowest returns for the year. The
volatility column to the far right displays the annual standard deviation of each asset class to its
immediate left; the higher the value, the more volatile that asset class’ price fluctuations.


Click here to view the entire chart and remember that past performance is not indicative of future results
Source: Koch Capital, InvestSpy
Color Matters
The asset classes are organized by color to make the table presentation more interesting. For example,
all the equity (stock) categories are shown in the blues and purples; the S&P 500, a common
equity benchmark, stands out in its signature black. The fixed income (bond) categories are in red,
orange and tan, and bleed into the yellow colors, which represent alternative asset categories. For this
demonstration, the alternatives include just gold and commodities. In green, cash (and cash
equivalents), the thirteenth asset class category, is represented by short-term Treasury bonds that
mature in one year or less.

The 2017 rising global tide lifts all boats, and most notably for the foreign developed and emerging
markets. Domestic US stocks weren’t shabby either providing double digit returns in both the large cap
and small cap arenas. Even the benchmark bonds in this example eked out positive returns in face of
moderately increasing interest rates.   

In summary, it was NOT a normal year for the world’s broad asset classes. The 2017 synchronized
global growth story, favorable expected fiscal policy changes in the form of US corporate tax and
regulatory relief, and continuing low interest rates contributed to the strong tailwind that drove these
terrific annual returns across the globe.

Pattern Hunting
As humans our brains naturally try to find patterns in what we see. Do you see any predictable pattern
of asset class returns from one year to the next? The answer is no. The point here is that asset class
returns are random no matter how convincingly your brain tells you, “Hey, I see a repeating historical
pattern here and I’m sure it will repeat in the future.”

Source:InvestSpy 1yr ETF correlations to 12/31/2017

The more subtle piece of information in the table above is the relationship between risk and correlation.
Even though long-term Treasury bonds TLT (red highlight) are volatile (risky), this asset class is
uncorrelated with most stock-based asset classes. When the S&P 500 SPY (black highlight) has
good year (over 10% annual return), long-term Treasury bonds (black) tends to under-perform, and
vice versa. Thus, you get the classic zig-zag relationship between stocks and bonds/alternatives, a
return saver courtesy of real diversification that helps your portfolio survive in years like 2008 and 2011.

Occasionally there will be years where both stocks (S&P 500) and bonds (US Gov’t 20yr Treasury)
deliver negative returns, although I haven’t recorded this outcome since starting the periodic table in
2001. It’s not a question of if but when this double barrel nasty outcome will occur, especially given this
year’s possible end to the 35-year bull market run in bonds. And when it does, make sure you have a
strategy to control your emotions and a plan to stay the course.
   

About Jim Koch
Jim Koch is the Founder and Principal of Koch Capital Management, an independent Registered Investment
Advisor (RIA) in the San Francisco Bay Area. He specializes in providing customized financial solutions to
individuals, families, trusts and business entities so they are better able to achieve their goals. Jim sees himself
as an “implementer” of financial innovation, using state-of-the-art technology to provide practical investment
management and retirement planning solutions for clients.

General Disclosures
This information is provided for informational/educational purposes only. The opinions referenced are as of the date of publication and are subject
to change due to changes in the market or economic conditions and may not necessarily come to pass. Nothing presented herein is or is
intended to constitute investment advice, and no investment decision should be made based on any information provided herein. The information
contained herein, while not guaranteed as to the accuracy or completeness, has been obtained from sources we believe to be reliable. Past
performance is no guarantee of future results.

Any forward looking statements or forecasts are based on assumptions and actual results are expected to vary from any such statements or
forecasts. No reliance should be placed on any such statements or forecasts when making any investment decision.Under no circumstances
does the information contained within represent a recommendation to buy or sell any particular security or pursue any investment strategy.
There is a risk of loss from an investment in securities.  Different types of investments involve varying degrees of risk, and there can be no
assurance that any specific investment will be profitable or suitable for a particular investor’s financial situation or risk tolerance. Asset allocation
and portfolio diversification cannot assure or guarantee better performance and cannot eliminate the risk of investment losses. Please refer to the
Site Disclosure page for additional information.

Third Party Information
While Koch Capital has used reasonable efforts to obtain information from reliable sources, we make no representations or warranties as to the
accuracy, reliability, timeliness, or completeness of third party information presented herein. Any third party trademarks appearing herein are the
property of their respective owners. At certain places on this website, live 'links' to other Internet addresses can be accessed. Koch Capital does
not endorse, approve, certify, or control the content of such websites, and does not guarantee or assume responsibility for the accuracy or
completeness of information located on such websites. Any links to other sites are not intended as referrals or endorsements, but are merely
provided for convenience and informational purposes. Use of any information obtained from such addresses is voluntary, and reliance on it should
only be undertaken after an independent review of its accuracy, completeness, efficacy, and timeliness.

Thursday, February 16, 2017

More On A Two-Dimensional Risk Assessment Process


Risk Tolerance vs. Risk Capacity
Kudos to Michael Kitces for another informative research article on the important differences between investment risk tolerance and financial risk capacity. In this blog post, I’ll add to risk assessment discussion by introducing an alternative method for measuring financial risk capacity.

In general terms, risk tolerance or risk preference is your emotional willingness to accept more investment risk for an expected higher return. Risk capacity, on the other hand, is essentially your ability to live with the outcome of depending on risky assets to build a sufficient retirement nest egg. The previous statement is my opinion of what risk capacity really is. The more classic definition is how much risk a client can afford to take without risking his/her objectives.  

In the Kitces article, Michael points out the importance of measuring both types of risk separately in order to prevent the averaging of the two measures leading to inaccurate client risk profiles. He further demonstrates how Monte Carlo financial scenario planning provides a good measure of risk capacity and can be helpful when combined with traditional risk preference analysis.

Source: Michael Kitces, www.kitces.com

Rather than depend on Monte Carlo probabilities of success, I’m suggesting that funded ratio, current household assets divided by future living expenses, is a better measure of risk capacity and should be favored in two-dimensional assessment of financial risk.

Risk Capacity Changes Over Time
Traditional risk tolerance tends remain relatively stable over an investor’s lifetime. That is until the investor experiences a huge portfolio drawdown like in 2008-09, then preferences always get more conservative much to the consternation of most advisors who recognize that the time to load up on stocks is when the public is terrified of the market.

Source:Koch Capital

Rick capacity can fluctuate considerably over an investor’s lifespan for the simple reason that it includes non-investment life events that affect a household’s financial capability to accept risk. Life happens. And even the best portfolio returns may not be enough to counter the negative financial effects of an unplanned medical emergency or personal crisis.

When using the funded ratio approach to measure household risk capacity, you’re not only accounting for both investment and non-investment assets, but also using a measurement system that can be updated daily to help you quickly adapt your investment plan before your lifestyle is impacted. At Koch Capital, we think of household funded ratio monitoring as a real-time compass to help guide you to and through retirement.

     
Source:Koch Capital

When using the funded ratio as your household’s risk capacity measure, you are essentially accounting for all the household asset resources at your disposal. These assets include your current financial accounts like IRAs and 401ks, your real property holdings, your future ability save money, and your future pension and social security benefits.

In academic parlance, these three reservoirs of savings are referred to as: Financial Capital, Human Capital, and Social Capital. Since risk tolerance (preference) tends to focus on just the Financial Capital side of the equation, you need a mechanism to map the investor’s risk tolerance back to the broader household’s financial risk capacity.

At Koch Capital, we use Riskalyze to measure client investment risk preference; specifically how much portfolio loss an investor can tolerant before he or she hits the eject button. On the risk capacity side, we use our own proprietary funded ratio tool to measure the household’s capacity to accept risk, right up to the dollar amount where the client’s lifestyle is impacted. The diagram below demonstrates how the two measures intersect in the two-dimensional risk assessment framework.

   
Source:Koch Capital

In this two-dimensional risk assessment framework, risk capacity (funded ratio) influences risk tolerance more than tolerance affects capacity. This is because an investor’s risk tolerance, for example, to be aggressively invested on the Financial Capital (portfolio) side is also influenced by the household’s other risk capacity resources—Human Capital and Social Capital.

For example, if your funded ratio (household assets dividend by future liabilities) is over 1.0 and your conservative Social Security benefits constituents the largest portion of your Financial, Human and Social Capital mix, then your retirement plan can probably withstand a more aggressive portfolio allocation on the smaller Financial Capital portion of your overall household asset base.

Stress Test Your Lifestyle Resilience Before Investing Capital
Let’s look at a numerical example of mapping your risk tolerance (Riskalyze) number into your risk capacity (funded ratio) using the two-dimensional risk assessment framework. First, you need to calculate your risk tolerance for all your household’s investment portfolios. I referred to this previously as your Financial Capital.

 
Source:Koch Capital, Riskalyze

Ideally, the retirement-aspiring investor should obtain a single, aggregated Riskalyze number for all portfolios associated with the household. One way to approximate this aggregated value is to (1) calculate/estimate a Riskalyze number for each investment account using the free Riskalyze risk assessment service, then (2) create a spreadsheet to calculate the weighted average Riskalyze number, or 57 in my educational example above.

Next, derive your potential portfolio loss number by using the following Riskalyze hack. Create a dummy Riskalyze client and enter your weighted average risk number and the total value of your investment accounts. In my example, the weighted average, target risk level is 57 and the aggregate account balance is $3,353,106.

Riskalyze provides both the potential downside loss and upside gain over the subsequent six months (see below). Unfortunately, either you or your advisor or your advisor friend will need to be registered Riskalyze user to gain access to this hack.

Source: Riskalyze.com

For this example, the -11% potential loss percent or -$384,870 potential loss number is what I’m looking for as a numerical expression of the client’s aversion to investment losses. Please remember that it’s just a downside estimate and by no means 100% accurate, but still a useful estimate to map against the investor’s risk capacity. The estimated downside loss number will tell us if the investor’s risk tolerance matches up with the reality of the household’s current financial capacity to accept this level of investment risk.

For the statistical inclined, the resulting downside loss number is a two standard deviation forecast over the next sixth months of how much this combination of portfolios could lose (or gain) without you hitting the panic button. But just know that a true black swan event, though rare, would result in a three or more standard deviation loss, and possible permanent loss of capital if the investor sells near the bottom and/or the subsequent market recovery doesn’t materialize. Hence, we are stress testing for the less severe, but more likely market correction scenario.   
 
Now let’s switch over to the risk capacity side using Koch Capital’s risk capacity tool.

Click here for balance sheet image field descriptions
Source: Koch Capital

The graphic above is an annotated screenshot example of Koch Capital’s dashboard app which calculates the household’s current funded ratio. It shows that 11% drop in this household’s portfolios translate to a reduction in its funded ratio from 1.21 (overfunded) to 1.13 (constrained). While this potential portfolio drop would be emotionally troubling, it’s not enough to change the retirement funding trajectory in this example since the funded ratio is still greater than one and the target retirement date is still many years away.

This example also demonstrates why shifting funds from your more risky investment assets to your safer income assets (government bond ladders, annuities, etc.) will limit the downward funded ratio pressure. The riskier investment side of household asset pie would become smaller, thus less of a potential negative influence on household’s funded ratio. This risk reduction strategy is referred to as the “safety-first” approach to retirement income planning.

Beans and Rice, Rice and Beans
As debt-free maven Dave Ramsey frequently points out, “you have to live like nobody else, to live like nobody else.” And if that takes an inexpensive diet of rice and beans for a while to help pay off an expensive credit card balance, then you control your personal finance destiny, even on a modest income.

I bring this up for the simple reason that I have devoted way too much attention to  Financial Capital, investment risk and growing your nest egg through stock market investing. In reality your Human Capital (ability to earn income and save) is usually your best wealth generation asset. And in most cases, it’s less risky than depending on stock market gains.   

As Dave points out, “change starts with you.” Even the best investment managers cannot predict what the stock market will do next. But you control your ability to save for specific financial goals.

The funded ratio planning approach helps you intelligently budget for the future known goals (home, college, retirement, legacy, etc.) and plan for future unknown costs (medical emergency, family crisis, etc.), then guides you down the path to the lifestyle you desire and can afford.

Your greatest household asset is your ability to earn income and save for the future.  And whether you are saving for a house or saving for retirement, you probably have more risk capacity than you think.  

Thank you for your interest and appreciate your feedback......Jim   


P.S. For anyone interested the funded ratio approach, please request your own demo here.


Household Balance Sheet and HHBS are a registered service marks of the Retirement Income Industry Association (RIIA)

Additional Resource Links

Michael Kitces - Adopting A Two-Dimensional Risk Tolerance Assessment Process:

Moshe Milevsky - It’s Time to Retire Ruin (Probabilities):

Riskalzye Blog - And the Average Risk Number is….

Jim Koch - Should You Be 100% Invested In Stocks?

Jim Koch - Retirement Funded Ratio: The One Number Every Retirement Seeking Investor Should Know And Manage:


About Jim Koch
Jim Koch is the Founder and Principal of Koch Capital Management, an independent Registered Investment Advisor (RIA) in the San Francisco Bay Area. He specializes in providing customized financial solutions to individuals, families, trusts, business entities and other advisers so they are better able to achieve their goals. Jim sees himself as an “implementer” of financial innovation, using state-of-the-art technology to provide practical investment management and retirement planning solutions for clients.

General Disclosures
This information is provided for informational/educational purposes only. The opinions referenced are as of the date of publication and are subject to change due to changes in the market or economic conditions. Nothing presented herein is or is intended to constitute advice to use or buy any of third-party applications presented here, and no purchase decision should be made based on any information provided herein. The information contained herein, while not guaranteed as to the accuracy or completeness, has been obtained from sources we believe to be reliable.
Third Party Information
While Koch Capital has used reasonable efforts to obtain information from reliable sources, we make no representations or warranties as to the accuracy, reliability, timeliness, or completeness of third party information presented herein. Any third party trademarks appearing herein are the property of their respective owners. At certain places on this website, live 'links' to other Internet addresses can be accessed. Koch Capital does not endorse, approve, certify, or control the content of such websites, and does not guarantee or assume responsibility for the accuracy or completeness of information located on such websites. Any links to other sites are not intended as referrals or endorsements, but are merely provided for convenience and informational purposes. Use of any information obtained from such addresses is voluntary, and reliance on it should only be undertaken after an independent review of its accuracy, completeness, efficacy, and timeliness.