
What Language Are You Speaking?
As an investment manager, Koch Capital is always striving to effectively communicate arcane portfolio statistics and performance data to the investor. The finance field in general, and the investment management field in particular, is loaded with difficult-to-understand jargon and acronyms. In this blog post, I attempt to introduce a simple dialect and straightforward methodology to better evaluate your favorite portfolio.
The One-Page Evaluation Summary
The figure below (Diagram #1) is Koch Capital’s one-page summary format that we use for evaluating and comparing up to three portfolios at the same time. Please note that the information in the diagrams below are shown for illustrative purposes only and should not be considered investment advice.
Click on the image below to view a large version in your browser
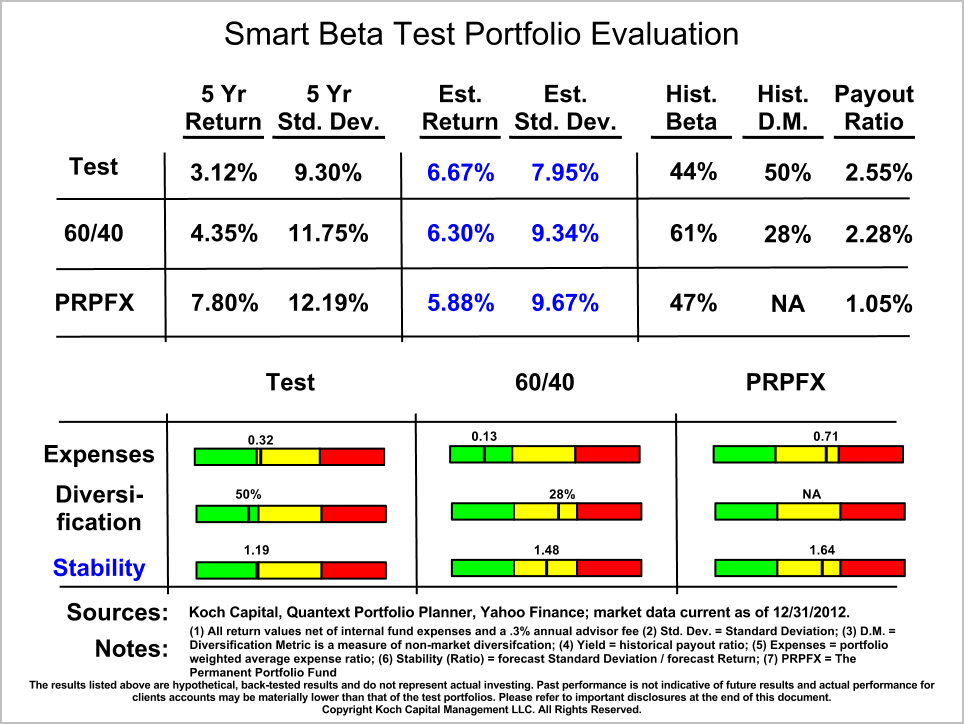
Diagram #1: The one-page portfolio evaluation summary
You’ll see the title of this particular portfolio evaluation at the top of the diagram. In this case, it’s related to the topic of “Smart Beta” portfolios, and in particular a “Test” smart beta portfolio that we are comparing against two other portfolios called the “60/40” and the “PRPFX” (which I’ll describe in more detail later). There are two main sections of this one-page summary. The top section presents the results for each of three portfolios analyzed. The bottom section grades those results using traffic light colors (green, yellow and red) to indicate a specific portfolio grade along three evaluation criteria: expenses, diversification and stability. Let’s take a closer look at each section.
The Results Section
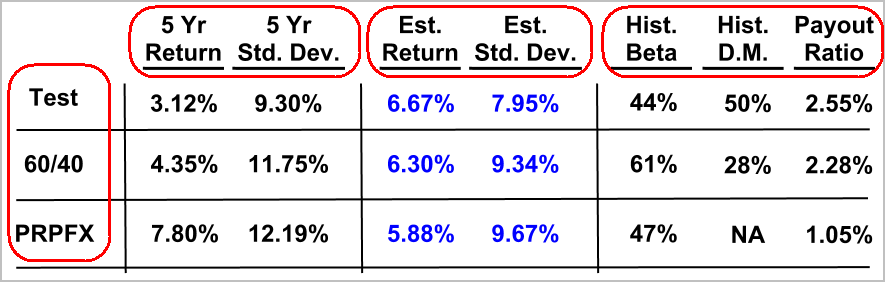
Diagram #2: The top half of the portfolio evaluation summary. Shown for illustrative purposes only. Past performance is not indicative of future returns. Please refer to important disclosures at the end of this document.
The top half of the summary page provides the results data in tabular format. The leftmost column provides an abbreviated name for the three portfolios—Test, 60/40 and PRPFX—which are generally names we have described in the written report that accompanies the one-page summary graphic. In this example, “PRPFX” is the symbol for a mutual fund, while “Test” and “60/40” are abbreviations for a smart beta test portfolio and a 60% stocks and 40% bonds benchmark portfolio, respectively.
The “5 Yr Return” and the “5 Yr Std. Dev.” columns provide the historical average total return and standard deviation for the time period listed. In this case, the period is the past five years as of the date listed in the footnotes (12/31/2012 in this example). In most portfolio evaluations, we generally use a three-year historical average for modeling purposes, but will vary the historical period from time to time depending on the nature of comparison. Also, the historical comparison period generally ends on the fiscal quarter end date—12/31, 3/31, 6/30 and 9/30—for compliance reasons.

Diagram #3: The “as of” evaluation date in the footnotes of the one-page summary
The “Est. Return” and “Est. Std. Dev.” columns provide Koch Capital’s forecasted long-term estimates of the total return and standard deviation for each of the portfolios in the comparison, looking forward from the “as of” date listed in the footnotes. We always highlight in blue forward-looking estimates for any metric used in a one-page evaluation summary. Forecasted values are our firm’s best estimate of where we believe the portfolio is heading, but obviously there is no guarantee it will be accurate. Nevertheless, the forecasted directional change from a historical trend is critically important to our overall investment management methodology, especially for managing future portfolio risk.
The “Hist. Beta”, “Hist D.M.” and “Payout Ratio” columns provide the historical portfolio beta, diversification metric and payout ratio for the period being evaluated. Portfolio beta measures how much of the portfolio’s return will be driven by (correlates to) the overall stock market’s gains and losses. A reported portfolio beta of 100% means the portfolio will move in lockstep with the overall stock market. If the reported portfolio beta is less than 100%, then the portfolio should experience less price volatility than the market.
The diversification metric (DM), courtesy of Quantext Portfolio Planner, measures how uncorrelated the non-market returns are across the portfolio. The higher the reported DM score, the less correlated (more diversified) the non-market components of individual security returns comprising the portfolio.
Koch Capital always reports these two measures together. In general, we want portfolio beta to be as low as possible to reduce volatility, which, in our opinion, improves portfolio return consistency. We also want the diversification metric as high as possible to provide true diversification, which in turn improves portfolio return sustainability. Portfolio return consistency and sustainability is an important theme you will see over and over in our investment management process.
The payout ratio provides the historical yield (distributions) on the portfolio. The sources of yield could include stock dividends, bond interest payments (coupons), capital gains, option premium (sale of options), return of principal and other special payout events. From a retirement income planning perspective, we use this information to help us forecast the cash flow generated from the portfolio prior to liquidating any holdings to cover a target distribution.
The Grading Section
The bottom half of the one-page evaluation summary utilizes Koch Capital’s unique portfolio grading criteria: expenses, diversification and stability.
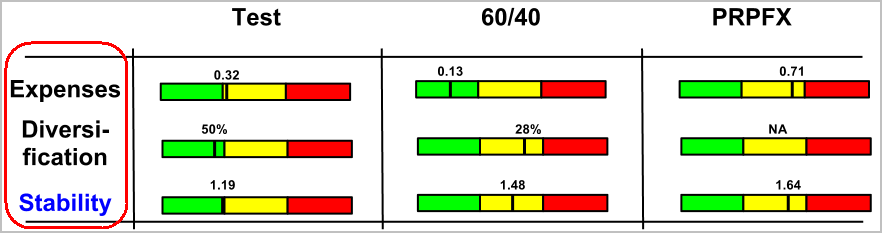
Diagram #4: Grading the three portfolios based on expenses, diversification and forward-looking stability.
Shown for illustrative purposes only. Please refer to important disclosures at the end of this document.
The first thing you’ll notice in Diagram #4 is the green, yellow and red color bands for each criteria and portfolio in the comparison. The “expenses” row refers to the portfolio’s expense ratio, or its ongoing, internal management fees if the holding is a mutual fund (MF), exchange-traded fund (ETF) or closed-end fund (CEF). The portfolio expense ratio is good predictor of long-term performance, in our opinion. The lower the ongoing portfolio’s expenses, the more you take home. However, the portfolio expense ratio does not reflect the total cost of ownership. Advisor fees, investor-initiated transaction costs, and hidden costs like bid-ask spreads are not included in the expense ratio computation. Moreover, these additional costs can significantly reduce your overall portfolio performance. However, a low expense ratio—we prefer less than .80% annually and, ideally, less than .30%—is a great place to start.
The “diversification” row displays that portfolio’s diversification metric or DM score on the green, yellow and red color scale. While low values are good on the expense side, high scores are better on the diversification metric side. We prefer portfolios with DM scores over 45% and would re-design a portfolio if its DM falls below 20%. In some portfolio evaluation scenarios, we may include a single stock or mutual fund for comparison with other multi-asset portfolios. In these cases, the portfolio receives a “NA” score for diversification because there is no other asset class to compare it to within its portfolio wrapper.
Finally, we provide the stability (ratio) score, which takes the forecasted portfolio standard deviation and divides it by the forecasted portfolio return. You’ll also notice this field is highlighted in blue to indicate it is a forward-looking measure of the portfolio’s long-term expected ability to deliver low volatility per unit of return produced. It’s essentially the inverse of the Sharpe Ratio, a risk-adjusted return measure. We grade the stability measure on a sliding scale, where we allow for more volatility (standard deviation) for higher return portfolios, but require lower stability values for portfolios projected to deliver lower returns. The entire sliding scale is provided on our grading help page.
The Footnotes
I’ve tried to make the footnote section as useful and concise as possible. Well, one out of two ain’t bad. The terminology definitions, fee disclosure and the general downside limitations of using hypothetical models are important considerations that every reader should fully understand before making his or her own investment decisions.
Click on the image below to view a large version in your browser

Diagram #5: The Notes section always contains important disclosure information and should be reviewed.
Final Thoughts
This portfolio evaluation methodology presented here is unique to Koch Capital. There are other portfolio evaluation methodologies available from the big vendors, like Morningstar and Charles Schwab, that provide valid but different insights into your portfolio. We chose to develop our own evaluation methodology because we could not find a commercially available product that focused on the two portfolio characteristics that we are most interested in, namely long-term portfolio return consistency and sustainability. Your feedback on this subject is always welcome. Thank you for your interest.
About Jim Koch
Jim Koch is the Founder and Principal of Koch Capital Management, an independent Registered Investment Advisor (RIA) in the San Francisco Bay Area. He specializes in providing customized financial solutions to individuals, families, trusts, business entities and other advisors so they are better able to achieve their goals. Jim sees himself as an “implementer” of financial innovation, using state-of-the-art technology to provide practical investment management and retirement planning solutions for clients.
General Disclosures
This information is provided for informational/educational purposes only. The opinions referenced are as of the date of publication and are subject to change due to changes in the market or economic conditions and may not necessarily come to pass. Nothing presented herein is or is intended to constitute investment advice, and no investment decision should be made based on any information provided herein. The information contained herein, while not guaranteed as to the accuracy or completeness, has been obtained from sources we believe to be reliable.
Any forward looking statements or forecasts are based on assumptions and actual results are expected to vary from any such statements or forecasts. No reliance should be placed on any such statements or forecasts when making any investment decision.Under no circumstances does the information contained within represent a recommendation to buy or sell any particular security or pursue any investment strategy. There is a risk of loss from an investment in securities. Different types of investments involve varying degrees of risk, and there can be no assurance that any specific investment will be profitable or suitable for a particular investor’s financial situation or risk tolerance. Asset allocation and portfolio diversification cannot assure or guarantee better performance and cannot eliminate the risk of investment losses. As with any investment strategy, there is potential for profit as well as the possibility of loss.
Hypothetical Results Disclosure
Performance data quoted represents past performance results for a hypothetical portfolio during the corresponding time period. Past performance does not guarantee future results. Actual returns depend on an investor’s situation and may differ from those shown. The current performance may be higher or lower than the quoted performance. All calculations were based on information obtained from sources we believe to be accurate, but we cannot guarantee the accuracy of such information. No current or prospective client should assume that future performance results will be profitable or equal the performance of the test portfolios.
The portfolio results reflect hypothetical, back-tested results, that were achieved by means of the retroactive application of a back-tested portfolio and, as such, the corresponding results have inherent limitations, including: (1) the portfolio results do not reflect the results of actual trading using client assets, but were achieved by means of the retroactive application of each of the referenced portfolios, certain aspects of which may have been designed with the benefit of hindsight ; (2) back-tested performance may not reflect the impact that any material market or economic factors might have had on the adviser’s use of the hypothetical portfolio if the portfolio had been used during the period to actually manage client assets; and (3) for various reasons (including the reasons indicated above), Koch Capital clients may have experienced investment results during the corresponding time periods that were materially different from those portrayed in the portfolio.
HYPOTHETICAL OR SIMULATED PERFORMANCE RESULTS HAVE CERTAIN INHERENT LIMITATIONS. UNLIKE AN ACTUAL PERFORMANCE RECORD, SIMULATED RESULTS DO NOT REPRESENT ACTUAL TRADING AND MAY NOT BE IMPACTED BY BROKERAGE AND OTHER FEES OR TRANSACTION COSTS. ALSO, SINCE THE TRADES HAVE NOT ACTUALLY BEEN EXECUTED, THE RESULTS MAY HAVE UNDER- OR OVER-COMPENSATED FOR THE IMPACT, IF ANY, OF CERTAIN MARKET FACTORS, SUCH AS LACK OF LIQUIDITY. SIMULATED INVESTING PROGRAMS IN GENERAL ARE ALSO SUBJECT TO THE FACT THAT THEY ARE DESIGNED WITH THE BENEFIT OF HINDSIGHT AND MAY NOT BE INDICATIVE OF FUTURE RESULTS. NO REPRESENTATION IS BEING MADE THAT ANY ACCOUNT WILL OR IS LIKELY TO ACHIEVE PROFITS OR LOSSES SIMILAR TO THOSE SHOWN. IN ADDITION, HYPOTHETICAL TRADING DOES NOT INVOLVE FINANCIAL RISK, AND NO HYPOTHETICAL TRADING RECORD CAN COMPLETELY ACCOUNT FOR THE IMPACT OF FINANCIAL RISK IN ACTUAL TRADING. FOR EXAMPLE, THE ABILITY TO WITHSTAND LOSSES OR TO ADHERE TO A PARTICULAR INVESTMENT PROGRAM IN SPITE OF LOSSES ARE MATERIAL POINTS WHICH CAN ALSO ADVERSELY AFFECT ACTUAL RESULTS. THERE ARE NUMEROUS OTHER FACTORS RELATED TO THE MARKETS IN GENERAL OR TO THE IMPLEMENTATION OF ANY SPECIFIC PROGRAM WHICH CANNOT BE FULLY ACCOUNTED FOR IN THE PREPARATION OF HYPOTHETICAL PERFORMANCE RESULTS AND ALL OF WHICH CAN ADVERSELY AFFECT ACTUAL RESULTS.
Use of Calculators, Planning Tools, and Other Devices
The use of any calculator, tool, or similar device contained within or linked to this website is subject to your acknowledgement and understanding that the projections or other information generated by any such tools is not, and should not be construed, in any manner whatsoever, as the receipt of, or a substitute for, personalized individual advice from Koch Capital, or from any other investment professional. The projections or other information generated by such tools regarding the likelihood of various investment outcomes are hypothetical in nature, do not reflect actual investment results, are not guarantees of future results, and may not reflect the actual growth or costs of your own investments. These tools are designed for informational and educational purposes only and should not be considered investment advice. No reliance should be placed on any such information when making an investment decision. Koch Capital makes no warranties of any kind, and disclaims liability to any person for any actions taken or omitted in good faith with respect to such tools. Koch Capital obtains the information provided via these tools from third party sources believed to be reliable but not guaranteed. Koch Capital is not responsible for the consequences of any decisions or actions taken as a result of information provided by such tools and does not warrant or guarantee the accuracy or completeness of the information requested or displayed. Please refer to the Site Disclosure page for additional information.
Third Party Information
While Koch Capital has used reasonable efforts to obtain information from reliable sources, we make no representations or warranties as to the accuracy, reliability, timeliness, or completeness of third party information presented herein. Any third party trademarks appearing herein are the property of their respective owners. At certain places on this website, live 'links' to other Internet addresses can be accessed. Koch Capital does not endorse, approve, certify, or control the content of such websites, and does not guarantee or assume responsibility for the accuracy or completeness of information located on such websites. Any links to other sites are not intended as referrals or endorsements, but are merely provided for convenience and informational purposes. Use of any information obtained from such addresses is voluntary, and reliance on it should only be undertaken after an independent review of its accuracy, completeness, efficacy, and timeliness.